Environment information
Kubernetes on GKE
Grafana Loki deployed as Helm chart
Chart: https://github.com/grafana/loki/tree/main/production/helm/loki
Version: 5.8.9
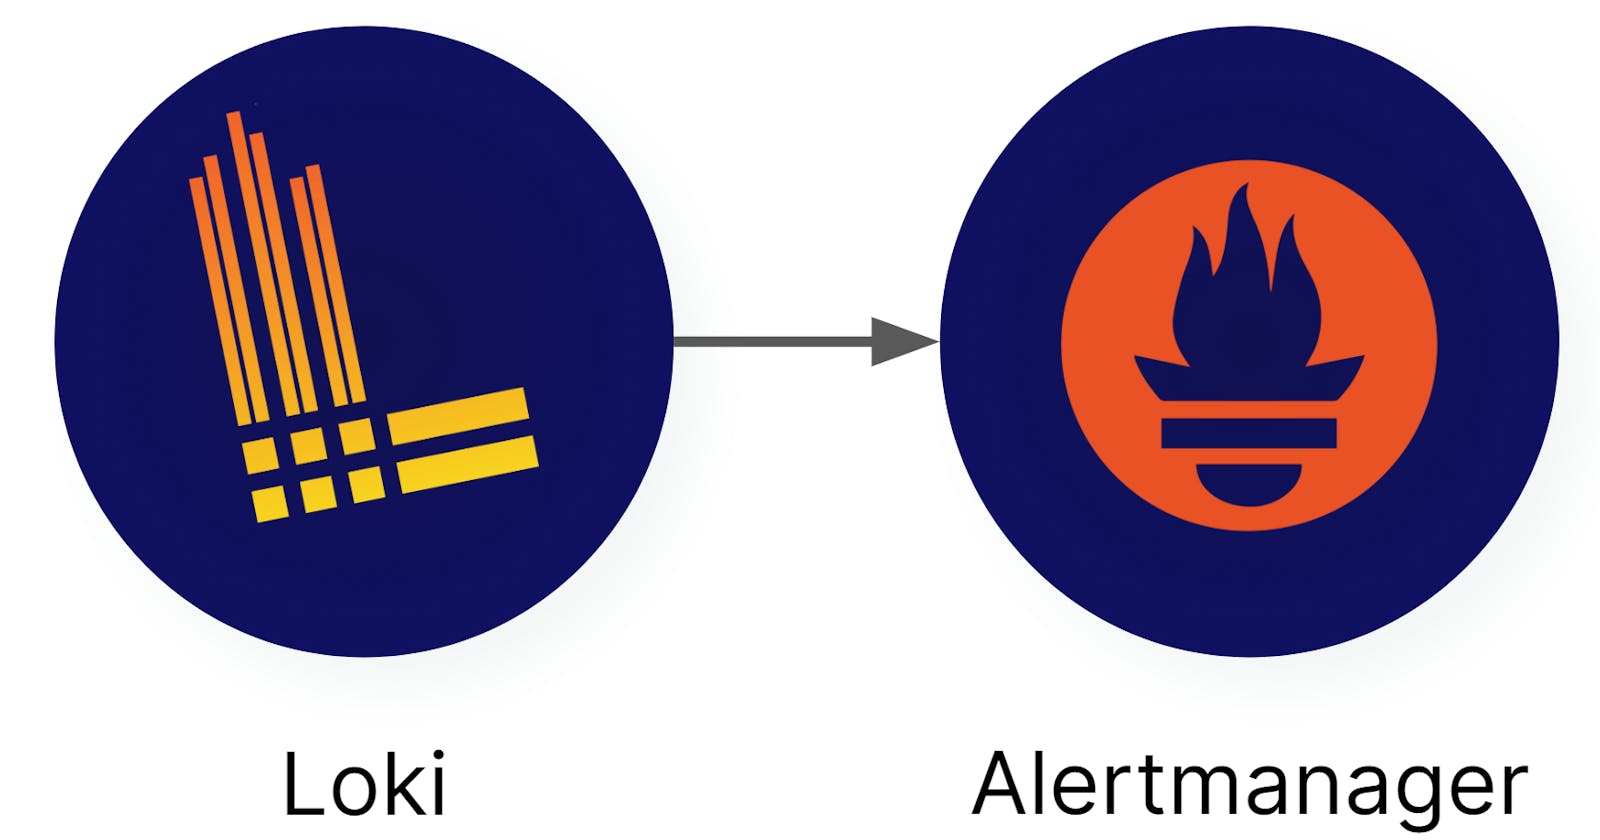
Grafana Loki is deployed along with the Kube Prometheus Stack
Alerts are processed by Alertmanager (part of the Kube Prometheus Stack)
Configuration
This is the content for the values.yaml for the Grafana Loki chart.
loki:
  auth_enabled: false

  storage:
    type: gcs
    .....
    ...
    ..

  schemaConfig:
    configs:
      - from: 2023-01-01
        store: boltdb-shipper
        object_store: gcs
        schema: v11
        index:
          period: 24h
          prefix: ........
        chunks:
          period: 24h


  # Alerts configuration - THE MOST IMPORTANT PART (1)
  rulerConfig:
    wal:
      # /var/loki is mounted as PVC
      dir: /var/loki/ruler-wal
    storage:
      type: local
      local:
        directory: /rules
    rule_path: /tmp/scratch
    # Internal address of Alertmanager
    alertmanager_url: http://kube-prometheus-stack-alertmanager:9093
    ring:
      kvstore:
        store: inmemory
    enable_api: true
    enable_alertmanager_v2: true
    # Enable sending metrics to Prometheus
    remote_write:
      enabled: true
      client:
        # Internal address of Prometheus
        url: http://kube-prometheus-stack-prometheus:9090/api/v1/write
  # ---

# Service Account used for Workload Identity to get access
# to the bucket used as storage.
serviceAccount:
  create: true
  name: loki-sa
  annotations:
    iam.gke.io/gcp-service-account: ....

# THE MOST IMPORTANT PART (2)
backend:
  # Alerts configuration
  extraVolumes:
    - name: loki-rules
      configMap:
        name: loki-rules
    - name: loki-rules-scratch
      emptyDir: {}
  extraVolumeMounts:
    - name: loki-rules
      mountPath: /rules/fake
    - name: loki-rules-scratch
      mountPath: /tmp/scratch
With the above configuration, Loki will be able to send alerts to the Alertmanager/Prometheus.
The following ConfigMap configures alerts and recording rules for Loki:
apiVersion: v1
kind: ConfigMap
metadata:
  name: loki-rules
  namespace: <the same namespace as Loki>
data:
  # Recording rule just as an example
  recording-rules.yaml: |-
    groups:
      - name: my_app
        interval: 5m
        rules:
          - record: loki:my_app:logs:count:1h
            expr: |
              count_over_time({app="my-app", container="my-container"} [1h])
  alert-rules.yaml: |-
    groups:
      - name: MyFirstGroup
        rules:
          - alert: ExampleAlert1
            expr: |
              absent_over_time({app="my-app"} [40m])
            for: 10m
            labels:
                severity: error
            annotations:
                summary: My app has stopped streaming logs.
                description: My app did not send any logs since 40m.
          - alert: ExampleAlert2
            expr: |
              sum by(app) (count_over_time({app="my-app"} | json | severity = `ERROR` | __error__="" [5m])) > 2
            for: 1s
            labels:
                severity: warning
            annotations:
                summary: 2 errors in logs has occured for my-app since 5m.
      - name: MySecondGroup
        rules:
          - alert: ExampleAlert3
            expr: ......
            for: ....
            labels:
                severity: warning
            annotations:
                summary: ...
                description: ....
The above alerting rules will appear on the alerts list in the Grafana dashboard.

